The Raftr Insights Dashboard is accessible by both Community Space Admins and Community Hub Admins on web only. Community Space Admins can view data for all members of their community; Community Hub Admins can view data for members within their department or solution.
Accessing the Raftr Insights Report
To access the Raftr Insights Report, go to the Admin Portal and select the Reports tab. The default report view is the Raftr Insights report, or you can click on Members & Sessions to see this report. The default view will be your community overview, or #1 using the left sidebar navigation. From there you can navigate to additional community metrics by clicking #2 and so on.
Customizing the Raftr Insights Report
The Raftr Insights report offers several customization options that allow you to vary your timespan or user segments for your data.
Date Filter
View your reports over a specific time period by selecting the date dropdown menu on the top right of the dashboard. The default time frame is the last 7 days. To change it, select a start date and end date from the calendar and select Apply. This can help you track changes and trends in community engagement over time.
Note: The percentage increase or decrease in a specific metric is based on the prior time period. If you change your time period from 7 to 14 days, for example, the prior time period will also change to 14 days.
Tags Filter
You can view your reports for a specific set of users based on User Tags. The Tags filter allows Admins to view the report for a specific set of users based on User Tags, which can help them track engagement among specific groups within their community (e.g., students, faculty, staff).
Select the Tags Filter dropdown menu to view a list of your available Tags. (Note that you can only filter one Tag at a time.) Select a checkbox next to a Tag to filter your Raftr Insights report to only show data for members with that specific Tag.
Solution Filter
Community Admins can filter data for this report by solution. The solution filter allows admins to filter data for all reports by solution, which can be useful for admins who manage multiple communities or solutions within their organization. If you have Community Admin permissions, simply click the dropdown and uncheck boxes for solutions you wish to exclude from your data. If you are a Department Admin, you will not see this filter.
Available Metrics on this Report
Below is a description of the metrics within the Raftr Insights report. You can navigate between these metrics by clicking menu items on the left side of the page, and maximize or minimize the menu by clicking < or > at the bottom of the menu.
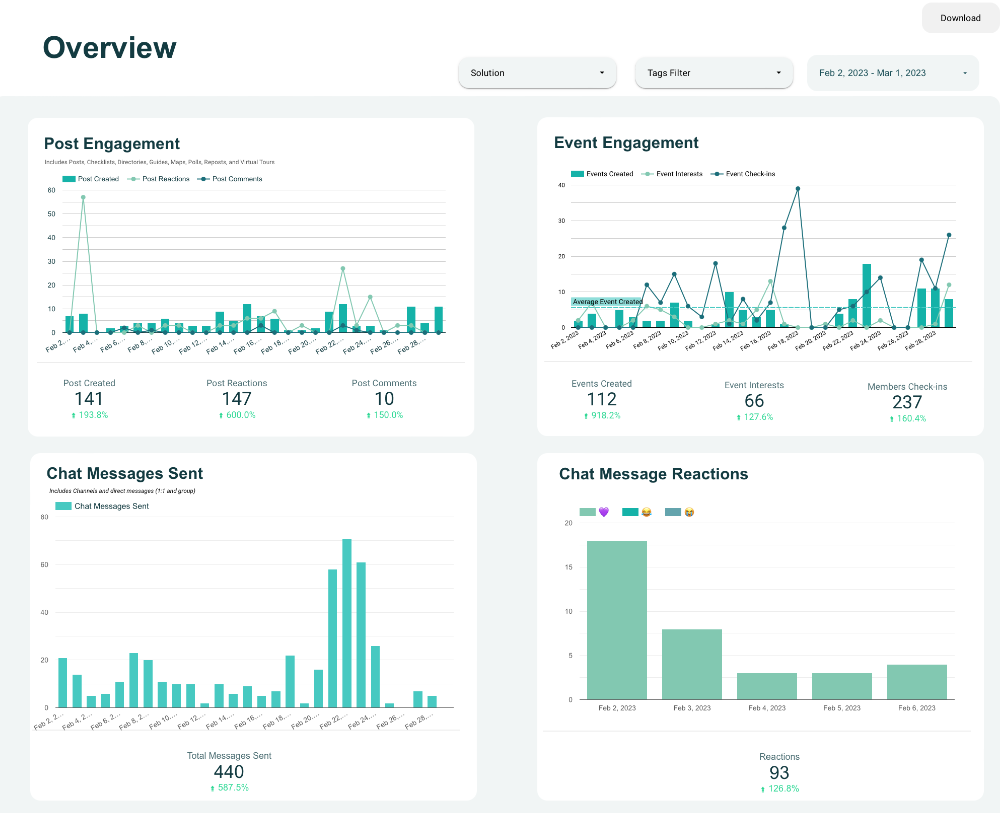
1 - Overview
To make it easier for Admins to quickly review their key metrics across content types and groups on a frequent basis, this report includes some of our most-used charts. If you want more detail on metrics for a specific content area, drill down into one of the content areas below the Overview. By default, this report displays metrics for the last seven days
Note on View Counts:
There are two types of view counts available for Events and Posts (all types):
In-app Views (Passive): Counted when a user passively scrolls past the content in a feed.
Report Views (Active): Counted when a user actively opens the specific content.
This distinction helps Admins understand the difference between overall reach (passive exposure) and deeper engagement (active interaction).
- Post Engagement – Shows reactions and comments on Posts in your community, as well as a total number of Posts and percentage increase or decrease compared to the previous time period (weekly by default).
- Event Engagement – Shows the daily total number of Events Created, Event Interests, and Event Check-ins for the time period you set, as well as a total number and percentage increase or decrease compared to the previous time period (weekly by default).
- Chat Messages Sent – Shows the daily total number of Chat Messages sent for the time period you set, including both Channel Chat, PMGs, and Direct Messages (DMs). The Total Messages Sent is the total for the time period you set, and includes a percentage increase or decrease compared to the previous time period (weekly by default).
- Chat Message Reactions – Shows the daily total number of Chat Message Reactions in Messages, as well as the top three emoji reactions utilized in your solution or community.
- Channels by Number of Messages – Displays Messages Sent for each Channel within your community or solution for the time period you have set (the last seven days by default), ordered by volume of messages. Only channels that have Messages Sent during the specified time period are displayed. This list is scrollable within the chart.
2- Chat
This report shows Metrics related to chat and messaging for your community, including direct messages (DMs), personal group messages (PMGs), Channels, and Raft Chat.
- Chat Messages Sent – Shows a bar chart with the daily and total number of messages sent during the selected time period across DMs and chat groups. Also includes a percent change in the totals. Click a bar in the chart to filter the data by that day.
- Chat Group Type – Shows a pie chart breaking down the total number of messages sent during the time period by type of chat group: DM or Channel. Selecting any section of the pie chart will filter all other charts on the Chat page to filter the data and only show activity on the chat group type selected .
- Channels by Number of Messages – Shows the total number of messages sent during the selected time period broken down by Channel name.
- Chat Message Reactions – Shows the daily and total number of reactions during the selected time period (along with percentage increase or decrease from the previous time period). Roll over a day to see the top emojis used that day.
3a - Event Post Activity
This report displays data and graphs related to Event Posts in your community and the amount of engagement your members are having with them. (NOTE: Event messages in Channels will appear in a separate section.)
- Creation – Shows a pie chart breakdown of the percentage of Events created by each persona in your community. Selecting a section of the pie chart will filter all other charts on the Event Post Activity page by that persona. Hover over a section to see specific amounts.
- Event Engagement – Shows the daily total number of events created, Event Interests (the number of members who marked themselves as interested in an Event), member check-ins (the number of members who checked in to an Event), Admin check-ins (number of check-ins made by the Event Admin), and Event views (number of times an event was viewed) for the time period you set, as well as a total number and percentage increase or decrease compared to the previous time period (weekly by default).
- Popular Events – Shows an area chart with the titles of the most popular Events in your community, according to the number of members who marked themselves Interested. The bigger the box, the more people were Interested.
3b - Events in Chat Activity
This report displays data and graphs related to Events in Chat Channels in your community and the amount of engagement your members are having with them.
- Creation – Shows a pie chart breakdown of the percentage of Events created by each persona in your community. Selecting a section of the pie chart will filter all other charts on the Event Chat Activity page by that persona. Hover over a section to see specific amounts.
- Engagement – Shows a bar chart with the daily and total number of Events Created, Event Interests, and Event Views per day and over the course of the selected time frame. Roll over the graph to see the breakdown of each Event engagement type. Also includes a percent change in the totals.
- Popular Events – Shows an area chart with the names of the most popular Events in your Chat Channels, according to the number of members who marked themselves Interested. The bigger the box, the more people were Interested.
4 - Posts
This report shows data and graphs related to the number of Posts in your community and the amount of engagement your members are having with them.
- Creation – Shows a bar chart with the number of Posts created during the selected time period broken down by type of Post and user persona. Selecting any section of the chart will filter all the other charts on the Posts page by that Post type and persona (for example, regular Posts created by staff). Hover over a chart section to see the specific numbers.
- Engagement – Shows a bar chart with the daily number of views (number of times a Post was viewed), reactions, and comments on Posts during the selected time period. Also includes a percent change in the totals compared to the previous period of time. Roll over a bar on the chart to see the breakdown by type of engagement for that day.
- By Raft – Shows the total number of Posts, reactions and comments created during the selected time period broken down by Raft.
5 - Polls
This report displays metrics related to the number and engagement with Poll messages and Poll Posts.
- Creation – Shows a pie chart breakdown of the percentage of Poll Posts created by each persona in your community during the selected time frame. Selecting a section of the pie chart will filter all other charts on the Poll page by that persona. Hover over a section to see specific amounts.
- Post Poll Engagement – Shows a bar chart with the total and average number of polls created, reactions, and comments on Poll during the selected time period. Also includes a percent change in the totals.
- Votes on Polls (Posts) – Shows an area chart with the names of the Poll that have received the most votes during the selected time period, as well as the total number of votes cast. The larger the box, the more votes the Poll received.
- Votes on Polls (Chat) – Shows an area chart with the dates of the Chat Polls that received the most votes during the selected time period, as well as the total number of votes cast. The larger the box, the more votes the Poll received.
6 - Checklists
This report displays charts and data related to activity on Checklist Posts and tasks.
- Engagement – Shows a bar chart with the total number of tasks viewed and completed by day and overall during the selected time period. Also includes a percent change in the overall totals over the previous time period.
- Tasks Completed By List – Shows an area chart with the names of the Checklists where the most overall tasks were completed by members. The larger the box, the more tasks were completed.
7 - Announcements
This report displays charts and data related to custom Announcements and their engagement.
- Engagement – Shows a bar chart with the total and average number of Announcements created and opened during the selected time period. Also includes the percent change in the totals.
- By Raft – Shows an area chart with the names of the Rafts with the most Announcement views. The bigger the box, the more Announcement views the Raft had.
8 - Community Hub
This report displays charts and data related to activity on the Community Hub.
- Community Page Views – Shows a bar chart with the total and daily number of Community Hub views for that time period.
- Extensions Opened – Shows the total number of clicks on each Extension for that time period.
- Actions – Shows a bar chart of the number of pinned Announcements opened during the selected time period and the number of times the Spotlight section was viewed.
Downloading Metrics
You can download the entire Insights report by selecting the Download button at the top right of the page and selecting Download as PDF.
You can download individual pages of the report by right-clicking the header of the individual report and selecting Download as PDF.

Some individual charts also include an option to download the metric as a CSV file or Google Sheet. To find this option, roll over the right side of the metric box - if it offers an export option, a three-dot (more) menu will appear. Select the format of your choice and select Export.

Was this article helpful?
That’s Great!
Thank you for your feedback
Sorry! We couldn't be helpful
Thank you for your feedback
Feedback sent
We appreciate your effort and will try to fix the article